Executive Summary
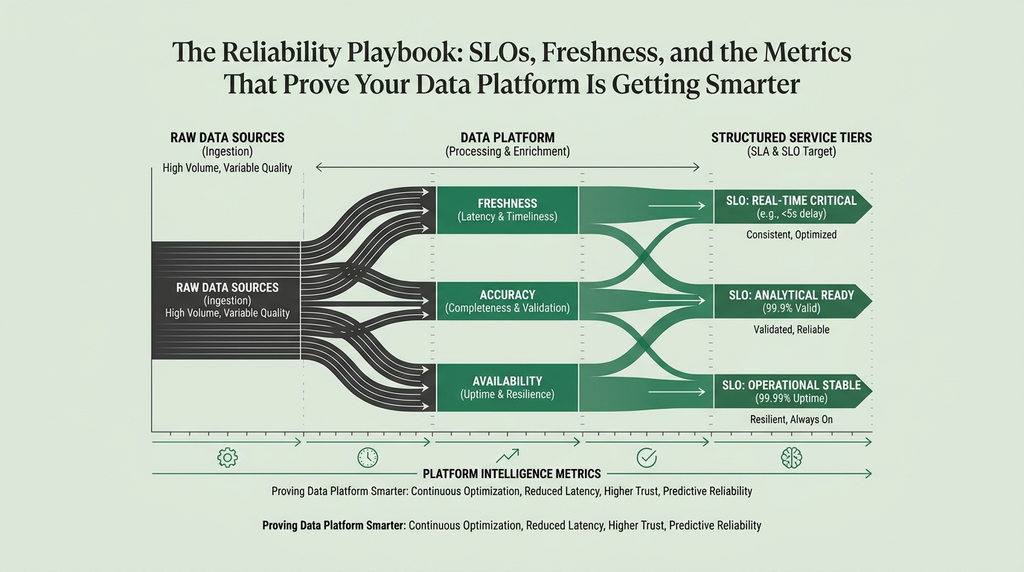
TL;DR — Data platform reliability is not about preventing every failure. It is about defining what "good" looks like, recovering fast when things break, and proving month over month that the platform is getting smarter, not just bigger.
- SLOs vs SLAs: SLOs are internal health targets; SLAs are external promises. Keep SLOs stricter so you never surprise a customer.
- Data freshness SLO: Measure age per source, not job status, and track the 95th/99th percentile to catch the long tail.
- Pipeline MTTR: Break recovery into detect, diagnose, repair, and verify — most gains come from faster detection and diagnosis.
- DLQ depth: Treat it as a leading indicator, not a safety net. Every spike is a clue.
- Ops intervention rate: The metric that proves the platform is becoming self-sufficient.
- Executive reporting: Translate technical signals into commitments, trends, and business outcomes.
- Incident response: A rehearsed routine — declare, contain, communicate, repair, review blamelessly.
- Alerting: Alert on SLO burn, not every twitch. Tier by urgency and tune continuously.
Most data platforms do not fail loudly. They erode quietly — a feed that lands an hour late, a silent schema drift, a queue that backs up overnight while everyone sleeps. By the time a dashboard looks wrong in a board meeting, the trust is already gone. Data platform reliability is not about preventing every failure. It is about defining what "good" means, measuring it honestly, recovering quickly, and proving — month over month — that the platform is getting smarter, not just bigger.
This playbook lays out the operating model we use to run data platforms as products with real service commitments. It covers the difference between internal targets and external promises using SLOs vs SLAs, how to make data freshness SLO targets a first-class metric, how to reduce pipeline MTTR to recover faster from incidents, and how to report all of it to executives in language tied to business value.
SLOs vs SLAs: Internal Targets and External Promises
The fastest way to spot an immature platform is to ask how it defines success. If the answer is "the pipelines run," there is no reliability model — only hope. Mature teams separate two concepts that are often conflated in SLOs vs SLAs discussions.
- SLIs (Service Level Indicators) are the raw measurements: data freshness, pipeline success rate, query latency, completeness.
- SLOs (Service Level Objectives) are the internal targets you hold yourself to — for example, "95% of collection runs deliver data less than 60 minutes old." SLOs are deliberately stricter than what you promise externally.
- SLAs (Service Level Agreements) are the external commitments with consequences attached — contractual or reputational. An SLA is what a customer or executive is allowed to hold you accountable for.
The relationship matters: your SLO should always be tighter than your SLA, and the gap between them is your error budget. If your SLA promises 99% freshness and your SLO targets 99.5%, that half-percent buffer is how much unreliability you can absorb before you are at risk of breaking a promise. When you breach an SLO, nothing burns externally yet — it is an early warning that says "slow down, stabilize." When you breach an SLA, you have broken a commitment, and that triggers a different, customer-facing response.
The executive takeaway: SLOs protect you from SLAs. A team that watches its error budget is a team that almost never surprises its customers.
Data Freshness as a First-Class SLO
For any platform whose value depends on current data, freshness is not a nice-to-have metric buried in a log — it is the product. A research or market-intelligence platform with stale data is, functionally, wrong. So a data freshness SLO deserves the same rigor as uptime.
A data freshness SLO framework for a collection pipeline has four layers:
- Define freshness per source, not globally. A daily filing feed and a real-time pricing feed cannot share one target. Each source gets its own data freshness SLO based on how fast the underlying world changes and how fast customers expect to see it.
- Measure data age, not job status. The wrong question is "did the job succeed?" The right question is "what is the timestamp of the newest record we hold versus the source?" A job can succeed and still deliver stale data if the upstream source did not update — you need to know the difference.
- Set tiered thresholds. Green (within target), amber (degraded but inside the error budget), red (SLO breach). Amber is where the smart teams intervene — before customers feel anything.
- Track freshness as a distribution, not an average. "Average freshness of 30 minutes" can hide a long tail where 5% of sources are a day behind. Report the 95th and 99th percentiles, because that tail is exactly where trust breaks.
Treating freshness as a first-class SLO changes behavior: it forces the platform to monitor the gap between the real world and its own copy of it, continuously, per source. For more on designing the ingestion layer this rests on, see our guide to building a data ingestion strategy that scales.
MTTR: Measuring How Fast You Recover
Almost every team talks about preventing failures. Far fewer can answer a sharper question: when something breaks, how fast do you recover? That number is pipeline MTTR (Mean Time To Recovery), and it is the truest measure of operational maturity, because failure is inevitable and recovery speed is a choice.
The pipeline MTTR decomposes into a chain you can attack one link at a time:
- Time to detect — how long until you know something is wrong. Driven by the quality of your monitoring and alerting.
- Time to diagnose — how long until you know why. Driven by data observability, lineage, and good logs.
- Time to repair — how long to apply the fix. Driven by runbooks, automation, and safe rollback paths.
- Time to verify — how long to confirm the data is correct again, not just that the job is green.
To reduce pipeline MTTR, instrument each stage and measure them separately. Most teams discover their biggest loss is in detection or diagnosis, not the fix itself. The highest-leverage investments are automated detection, end-to-end data lineage provided by comprehensive data observability so you can trace a bad number to its source in minutes, and pre-written runbooks so on-call engineers are executing a plan rather than improvising. Our lakehouse operability and monitoring guide goes deeper on the observability layer that makes fast diagnosis possible.
Dead Letter Queue Depth: A Symptom, Not a Safety Net
A dead letter queue (DLQ) is where records go when they cannot be processed. Immature teams treat the DLQ as a safety net — a place failures land quietly so the pipeline keeps moving. Mature teams treat DLQ depth as an operational signal: a leading indicator that something upstream has changed.
The depth and rate of change of the DLQ tell a story:
- A sudden spike usually means a schema change, an upstream format break, or a bad deploy — something systemic, not random.
- A slow, steady climb suggests creeping data-quality decay or an edge case that is becoming common.
- A queue that never drains means no one owns reprocessing, and you are silently losing data.
So DLQ depth should be a monitored metric with its own thresholds and alerts, treated as a symptom indicator within your data observability stack. The goal is not an empty DLQ at all costs — it is a DLQ that is small, well understood, and actively worked down, with every spike investigated as a clue about data platform reliability.
The Ops Intervention Rate: Is the Platform Getting Smarter?
Here is the metric that separates a platform that scales from one that just gets more expensive: the ops intervention rate — how often a human has to step in to keep the platform healthy, normalized against volume.
Measure it as manual interventions per unit of work — per thousand pipeline runs, per terabyte processed, or per source onboarded. The absolute number of incidents will rise as you grow; that is expected. The question is whether the rate is falling. A declining ops intervention rate is hard proof that automation, self-healing, and better design are outpacing complexity. A flat or rising rate means you are buying growth with human toil, and that does not scale.
This metric matters because it reframes data platform reliability as a trend, not a status. It answers the question every executive funding a platform actually cares about: "Is this thing becoming more efficient over time, or am I just hiring more people to keep it running?" Tracked monthly, the ops intervention rate becomes the single clearest signal of whether engineering investment is compounding.
Communicating Platform Health to Executives
Engineers measure latency and queue depth. Executives fund outcomes. The job of a monthly platform health report is to translate technical data observability into business results without dumbing it down. A strong report has five parts:
- The headline verdict. One line: are we meeting our commitments, yes or no. Lead with it.
- SLA performance against promises. Did we keep what we promised customers? Show the number against the target, and how much error budget remains.
- Trends that matter. Data freshness SLO percentiles, pipeline MTTR, and ops intervention rate over time — direction is the story, not the snapshot. A falling legacy drift and intervention rate is a maturity narrative executives understand.
- Incidents in business terms. Not "the Kafka consumer lagged," but "for 40 minutes, pricing data was up to two hours stale, affecting one customer-facing report; here is what we changed so it does not recur."
- Where the investment is going. Tie the next month of work to the metrics it will move.
The principle: report on commitments and trends, not raw telemetry. An executive should be able to read the first line and know whether to relax or ask a hard question.
Incident Response When You Breach an SLO
Under pressure, teams reveal whether they have a process or are winging it. A structured incident response for an SLO breach follows a repeatable arc:
- Declare. Name the incident, assign a single incident commander, and set a severity. Ambiguity about who is in charge is the most common cause of slow recovery and high pipeline MTTR.
- Contain. Stop the bleeding before you chase the root cause. Pause a bad feed, fail over, or roll back. Protect downstream consumers first.
- Communicate. Tell stakeholders what is affected, in their terms, and when they will hear from you next. Silence during an incident destroys more trust than the incident itself.
- Diagnose and repair. Work the MTTR chain — detect, diagnose, repair, verify — assisted by modern data observability tools, and confirm the data is correct, not just that the job is green.
- Review, blamelessly. Every meaningful breach gets a written post-incident review focused on systems and signals, not individuals. The output is concrete changes: a new alert, a runbook, an automated guardrail.
The error budget makes this objective. When it is healthy, you can keep shipping. When a breach burns through it, the same process triggers a deliberate shift toward stabilization. Incident response is not heroics — it is a rehearsed routine that turns every failure into a permanent improvement for data platform reliability.
Right-Sizing Alerts: Avoiding Fatigue and Blind Spots
Too many alerts are as dangerous as too few. A team drowning in noise learns to ignore the one alert that mattered. The discipline is to alert on symptoms that require human action, not on every twitch in the system recorded by data observability tools.
Three rules keep alerting healthy:
- Alert on SLO burn, not raw events. Page a human when the error budget is being consumed fast enough to threaten a commitment — not every time a single job retries. Most transient failures self-heal and should never wake anyone.
- Tier by urgency. A page means "act now"; a ticket means "look today"; a dashboard means "trend to watch." Routing every signal to the same channel is how fatigue starts.
- Tune continuously. Every alert that fires and required no action is a candidate for de-escalation. Every alert that should have fired and did not is a gap in coverage. Review both monthly. The goal is not more alerts — it is the right alerts, and a team that trusts them.
The right alerting posture makes data platform reliability a sustainable practice. It ensures that when a human is woken up, it is because something actually requires judgment, not because a dashboard flickered.
Reliability is not a destination. It is a set of honest commitments, visible metrics, and disciplined habits that compound over time. Define your data freshness SLO. Measure your pipeline MTTR. Watch your ops intervention rate. Report in business language. Respond to incidents with structure, not panic. And keep tuning your alerts until the humans only hear what matters. That is how a data platform earns trust — not by being perfect, but by being predictably good, and getting better.