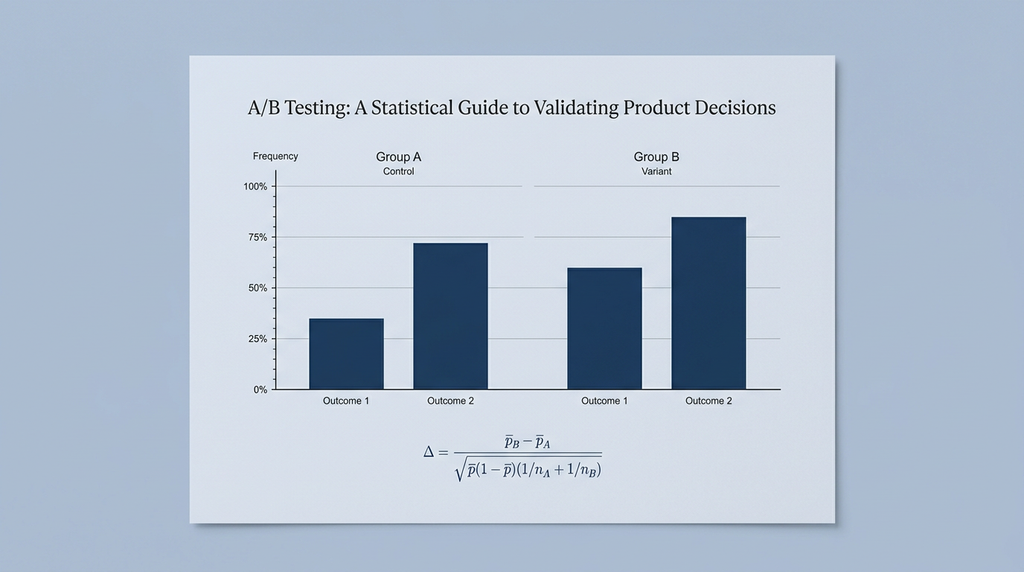
A/B testing is the practical way teams move from "I think this is better" to "the data shows this is better." It is a statistical method that compares two variants of a product, page, or process and determines which one performs better against a target metric. Instead of relying on intuition, you split users randomly into a control group (A) and a treatment group (B), expose them to different versions, and measure whether the difference in outcomes is real or just random noise. That is how product, growth, and engineering teams use product experimentation to decide whether a new feature, headline, or checkout flow actually improves conversion, retention, or revenue.
How A/B testing works in practice
At its core, A/B testing is a controlled experiment based on hypothesis testing. You keep everything identical except the one thing you want to test. Then you collect outcomes from each group and use statistics to judge whether the treatment meaningfully moved the metric.
For a conversion-rate test, the standard test statistic is a two-proportion z-test:
Z = (p̂B − p̂A) / √[p̄(1 − p̄)(1/nA + 1/nB)]
Where:
- p̂A, p̂B = observed conversion rates in the control and treatment groups
- p̄ = pooled proportion under the null hypothesis (no difference)
- nA, nB = sample sizes per group
The larger the absolute Z-score, the more unlikely the observed difference happened by chance. If |Z| exceeds a critical threshold (for example, 1.96 for a 95% confidence level), you reach statistical significance, reject the null hypothesis, and conclude the treatment had a measurable effect.
The six-step A/B testing workflow
- Define the metric. Pick one primary metric that matters to the business — sign-ups, checkout completion, revenue per visitor, or retention at seven days.
- Set the minimum detectable effect (MDE). Decide the smallest lift that would justify deploying the change. A 5% relative lift may be valuable at scale; a 0.1% lift may not be worth the engineering cost.
- Calculate the required sample size. Use the desired statistical significance level (α, typically 5%), statistical power (1 − β, typically 80%), and the MDE to estimate how many users each group needs.
- Randomly assign users. Randomization balances confounding variables across groups. Every user should have the same chance of landing in A or B, and the assignment should be stable for the duration of the test.
- Run until you reach the target sample size. Stopping early because a metric looks good is called peeking and inflates false-positive rates.
- Compute the result and make a decision. Compare the Z-score to the critical value. Reject the null if the threshold for statistical significance is crossed; otherwise fail to reject and keep the control or iterate.
A concrete example
Imagine a SaaS company wants to test a new landing-page headline. The current headline converts at 5%, and the product team hopes the new version converts at 5.5% — a 10% relative lift.
With α = 5% and 80% power, the calculator returns roughly 13,000 users per group. After random assignment, the control converts 5.02% and the treatment converts 5.51%. The Z-score is 2.04, which exceeds the 1.96 threshold. The team rejects the null and ships the new headline, knowing there is a controlled chance of a false positive.
Without A/B testing, the team might have shipped a headline that looked better for a week but was actually within normal variance. The test separates signal from noise.
Classical A/B testing vs. Bayesian A/B testing
Classical A/B testing is the framework most people encounter first. It gives a binary decision — reject the null or fail to reject — based on p-values and fixed sample sizes. It is well understood by stakeholders, easy to audit, and maps cleanly to regulatory and financial environments.
Bayesian A/B testing takes a different approach. It maintains a probability distribution over the treatment effect and answers the question directly: "What is the probability that B is better than A?" It can stop early when confidence is high enough, and it can incorporate prior knowledge into the model. The trade-off is that it requires choosing a prior and is more complex to explain to a non-technical audience.
Classical is often the right default when you need clear, defensible process. Bayesian is valuable when decisions are sequential, priors are genuinely informative, or you want to communicate uncertainty in business terms.
When to use A/B testing
Use A/B testing when you need to validate product changes with statistical significance before rolling them out to everyone. It is the right tool for:
- Conversion rate optimization on landing pages, checkout flows, and onboarding
- Feature rollouts that could affect engagement or revenue
- Algorithm and recommendation changes where lift is measured in small percentages
- Marketing campaigns where the cost of a wrong decision is high
Do not use A/B testing when the sample size is too small, the metric is lagging by months, or the ethical or operational cost of withholding a better treatment is unacceptable.
Common pitfalls to avoid
- Peeking at results. Checking the test repeatedly and stopping at the first positive-looking result inflates false positives. Decide the stopping rule in advance.
- Multiple comparisons. Running many variants or metrics without correction increases the chance of a spurious win.
- Low statistical power. A test that is too small may miss a real improvement. Power should be calculated before launch.
- Biased randomization. If assignment is not truly random, observed differences may reflect confounding variables rather than the treatment.
- Ignoring practical significance. A result showing statistical significance with only a 0.3% lift may not matter operationally. Always pair statistical significance with business impact.
From experimentation to decision-making
A/B testing is not just a statistical ritual. It is a decision-making discipline within a broader strategy of product experimentation. It forces teams to define success up front, expose ideas to real user behavior, and accept that some ideas will fail. The companies that run experiments well treat failed tests as learning rather than waste, and they build systems that make running the next test cheaper and faster.
Done well, A/B testing creates a flywheel: better measurement, better decisions, and better products over time.
Frequently Asked Questions
What is the main difference between A/B testing and multivariate testing?
A/B testing compares exactly two variants of a single element, such as one headline against another. Multivariate testing changes multiple elements at the same time and uses statistics to isolate the contribution of each factor. A/B testing is simpler and faster; multivariate testing requires more traffic and is better suited to optimizing combinations of UI elements.
How long should an A/B test run?
Run the test until it reaches the pre-calculated sample size for each group, not until the metric looks positive. Stopping early is called "peeking" and inflates the false-positive rate. The duration also needs to cover full business cycles so results are not skewed by weekday, seasonal, or promotional effects.
What is statistical power and why does it matter?
Statistical power is the probability that the test will detect a true effect of the size you care about. A power of 80% means there is a 20% chance of missing a real improvement. Under-powered tests are common and lead teams to discard good ideas because the signal never reached statistical significance.
Can you run A/B tests on small audiences?
You can, but small audiences require large relative lifts to reach statistical significance. If your traffic is low, consider sequential testing, Bayesian methods with informative priors, or running the test longer. Otherwise you risk declaring a winner when the difference is just random noise.
What does a p-value actually tell you?
The p-value is the probability of observing your results, or something more extreme, if the treatment had no true effect. A p-value below 0.05 does not mean there is a 95% chance the new variant is better; it means the data would be unusual under the null hypothesis. Interpret p-values alongside effect size, confidence intervals, and business impact.
When is Bayesian A/B testing a better choice than classical testing?
Bayesian methods are useful when decisions are sequential, you have strong prior knowledge, or you need to communicate uncertainty as a business probability. They can stop sooner when evidence is strong, but they also require careful choice of priors and can be harder to explain to stakeholders.
What is the minimum detectable effect (MDE) and how do you decide on it for conversion rate optimization?
The MDE is the smallest lift that would justify deploying the change. Choose it by weighing the business value of the improvement against the cost of implementation, maintenance, and risk. A 5% relative lift may be worth shipping at scale; a 0.5% lift may not be worth the engineering and operational burden.
What are the most common mistakes that invalidate A/B test results?
The most common mistakes are peeking at results before the planned stopping point, running multiple comparisons without correction, biased or unstable user assignment, under-powered samples, and ignoring practical significance. Good product experimentation teams document the hypothesis testing framework, metric, sample size, and stopping rule before launch.
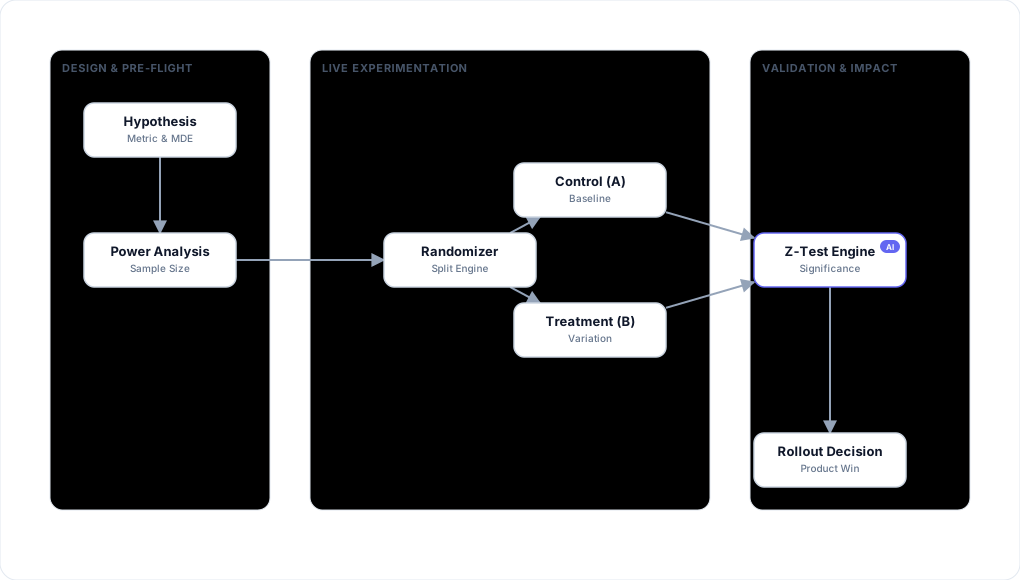
This diagram illustrates the end-to-end A/B testing workflow, emphasizing the transition from hypothesis-driven setup to data-driven product decisions.